The average Instagram engagement rate in 2026 is about 0.3% to 0.5%, where engagement rate means likes plus comments, divided by followers, times 100. Quid measured 0.30% for brand posts on Instagram this year, and Socialinsider measured 0.45% for Reels. That means if your engagement rate is above 0.5%, your posts are already doing better than the average post on Instagram.
Though, that average covers a huge number of posts, and most of them never go viral. When one of your Reels does go viral, its engagement rate can land far above the average, sometimes above 100%. The average tells you that your Reel did well, but it can't tell you whether a number that high is normal for a viral Reel.
To find out what a viral Reel's engagement rate looks like, we took 8,300+ Reels that Sociable AI flagged in their first hours as likely to take off, all posted between May and September 2026, and checked their likes, comments and views in October. About 2,400 of them went viral, meaning they reached 1 million views or got at least ten times as many views as the account has followers. Here's a quick summary of what we found.
- A viral Reel from an account with under 100,000 followers typically got likes and comments equal to about two to two and a half times the account's follower count.
- For accounts with 100,000 to 1 million followers, the typical viral Reel got about 49%, and for accounts over 1 million followers about 5%.
- Engagement rate by views was about 5.5% for viral Reels, close to the 4.6% for Reels that didn't go viral.
- On Reels with 1 million to 10 million views, there were about 3,000 views for every comment.
Engagement rate of viral Reels by follower count
The smaller the account, the higher a viral Reel's engagement rate. For accounts under 100,000 followers, the typical viral Reel landed somewhere around 200% to 260%. For accounts over 1 million followers, the typical viral Reel landed at about 5%.
Typical here means the median, so half of the viral Reels in a follower range were above that number and half were below it. The middle half runs from the 25th percentile to the 75th percentile, so half of the viral Reels in each range landed inside it. For comparison, each row also gives the typical Reel from the same follower range that didn't go viral, so you can see how big the jump is.
| Followers | Viral Reels, typical | Viral Reels, middle half | Reels that didn't go viral, typical |
|---|---|---|---|
| Under 1,000 | 226% | 82% to 1,721% | 6.8% |
| 1,000 to 10,000 | 198% | 71% to 583% | 3.4% |
| 10,000 to 100,000 | 258% | 123% to 604% | 3.9% |
| 100,000 to 1 million | 49% | 23% to 102% | 1.9% |
| Over 1 million | 4.8% | 1.8% to 10.7% | 0.6% |
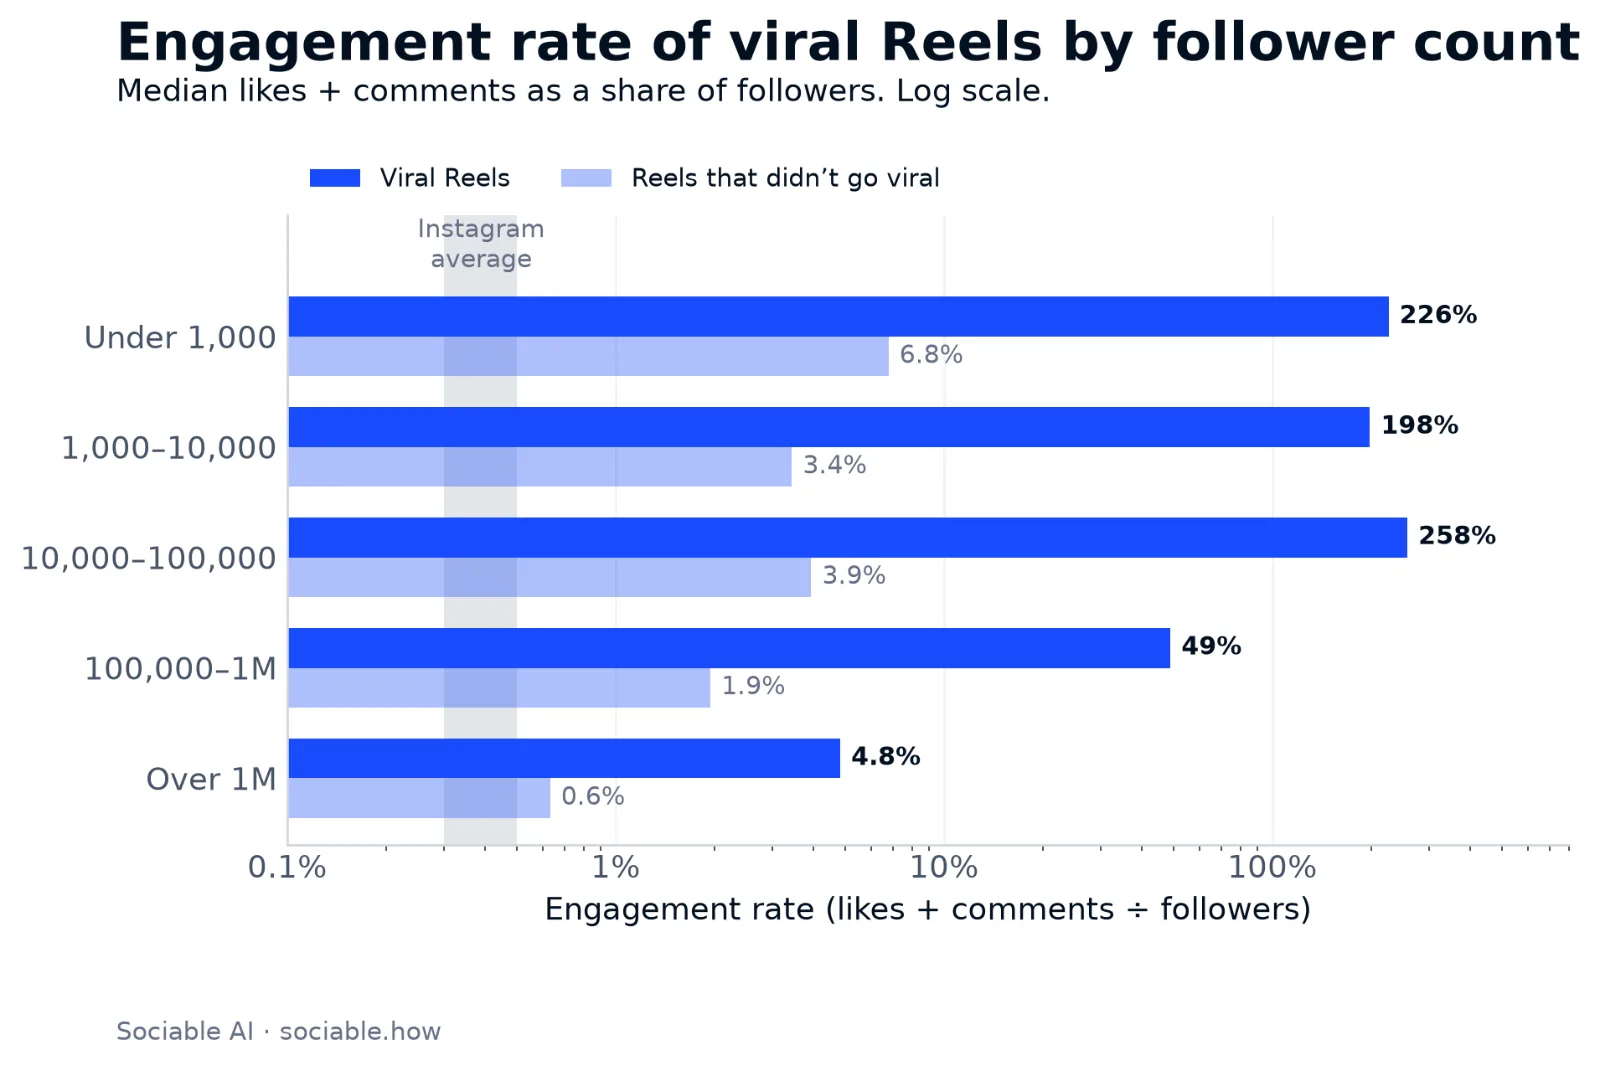
Typical engagement rate of viral Reels and Reels that didn't go viral, by follower range, with the 0.3% to 0.5% Instagram average marked for comparison.
If your viral Reel's engagement rate falls inside the middle half for your follower range, it's a typical viral Reel for an account your size. If it's above the middle half, it did better than three out of four viral Reels from accounts your size.
Why a viral Reel's engagement rate can pass 100%
A viral Reel's engagement rate can pass 100% because the Reel is shown to far more people than the account's followers, while the formula only divides by followers. Every extra viewer is another chance at a like or a comment, so once views climb well past the follower count, likes and comments can climb past it too.
Here are the typical views behind the viral Reels in each follower range.
- Under 1,000 followers, about 12,500 views.
- 1,000 to 10,000 followers, about 157,000 views.
- 10,000 to 100,000 followers, about 1.4 million views.
- 100,000 to 1 million followers, about 2.3 million views.
- Over 1 million followers, about 2.5 million views.
Let's say an account with 5,000 followers posts a Reel that gets 150,000 views. If about 5% of those viewers like or comment, the Reel ends up with 7,500 likes and comments. Divided by the 5,000 followers, that's an engagement rate of 150%, even though only one viewer in twenty did anything.
The same reasoning explains why the biggest accounts sit at about 5%. Viral Reels from accounts with over 1 million followers typically got views roughly equal to the account's follower count. Since the views weren't much higher than the number the formula divides by, the rate didn't get pushed up the same way.
Engagement rate by views is the better benchmark for a viral Reel
About 5.5% of a viral Reel's viewers liked or commented, compared with about 4.6% for Reels that didn't go viral. Since reach is what pushes the follower-based rate up, dividing by views instead of followers takes reach out of the number and leaves how often the people who saw the Reel engaged with it. That number is the engagement rate by views, and it stays in a narrow range at every account size.
| Followers | Viral Reels | Reels that didn't go viral |
|---|---|---|
| Under 1,000 | 4.1% | 3.9% |
| 1,000 to 10,000 | 5.3% | 4.5% |
| 10,000 to 100,000 | 7.1% | 5.3% |
| 100,000 to 1 million | 6.1% | 4.9% |
| Over 1 million | 5.1% | 4.1% |
Viewers of a viral Reel engaged a little more often than viewers of other Reels, by less than two percentage points in every follower range. All this is to say, the big difference in the follower-based rate came almost entirely from the extra views. For the smallest accounts, for example, the follower-based rate jumped from 6.8% to 226% while the engagement rate by views only moved from 3.9% to 4.1%.
To check your own Reel, open it in Instagram Insights, where views are listed for each Reel. Divide likes plus comments by views and multiply by 100, which is the same engagement rate formula with views in place of followers. Anything between about 4% and 7% is in line with the viral Reels in our data.
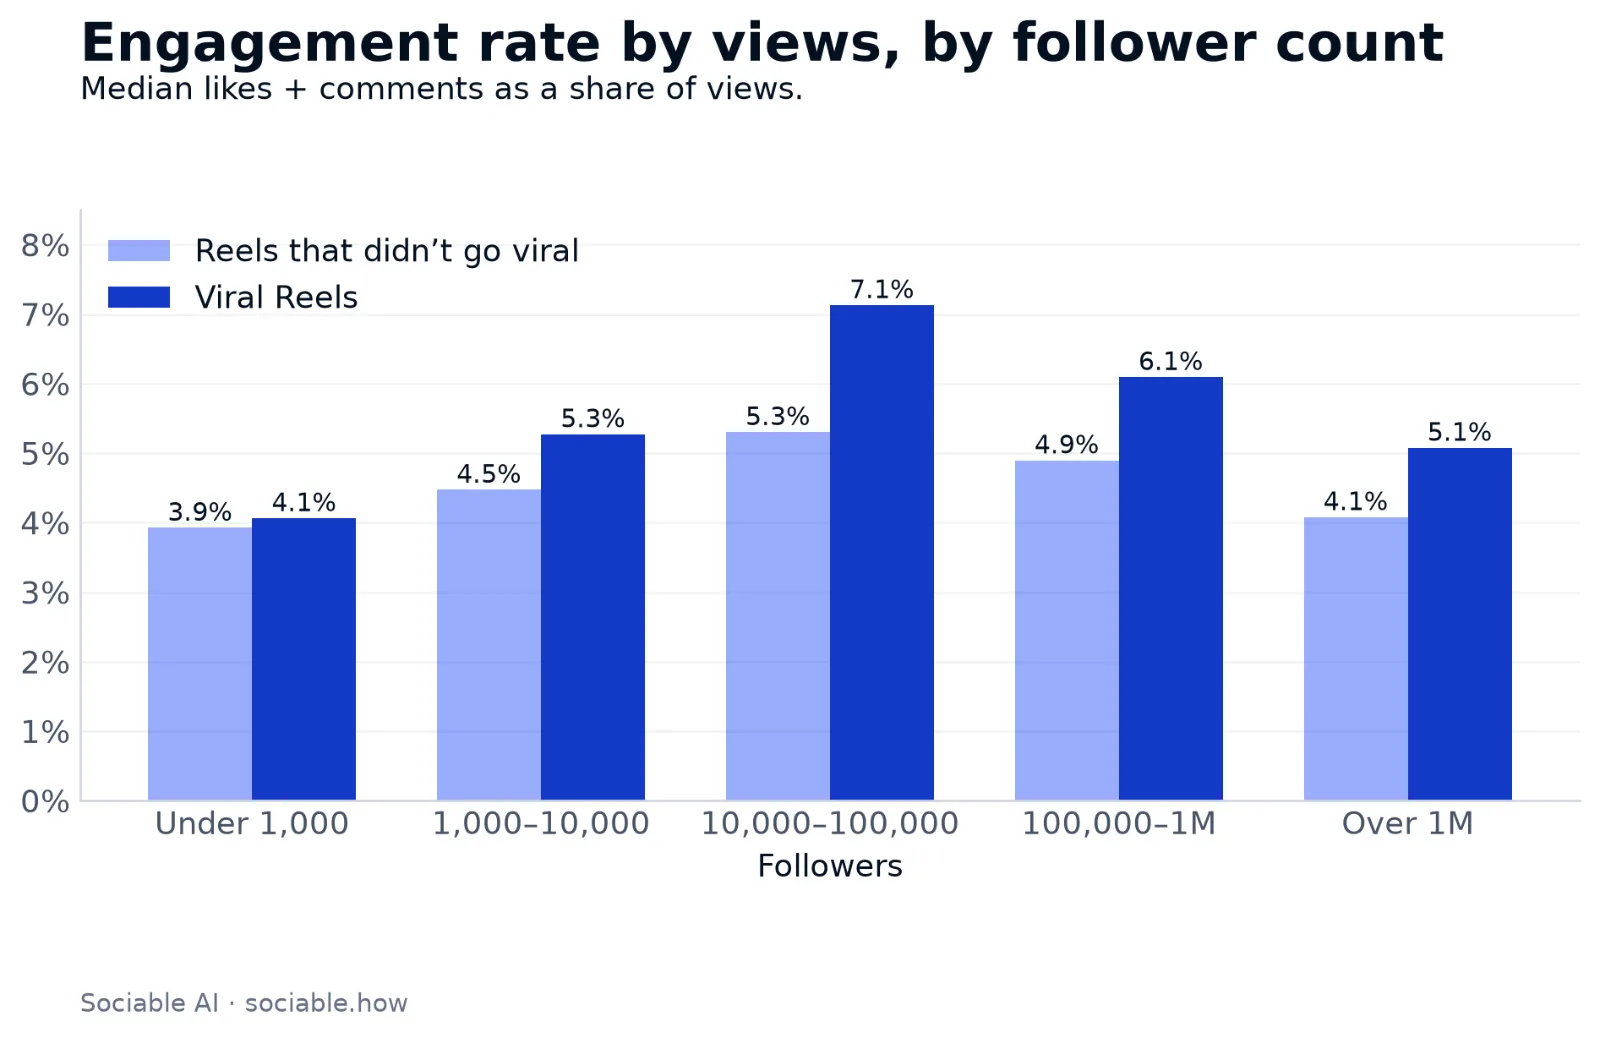
Typical engagement rate by views for viral Reels and Reels that didn't go viral, by follower range.
Bigger Reels get fewer comments per view
A Reel with more views gets more comments in total, but fewer comments for each view.
| Reel views | Typical comments | Views per comment |
|---|---|---|
| Under 10,000 | 3 | about 320 |
| 10,000 to 100,000 | 30 | about 1,100 |
| 100,000 to 1 million | 156 | about 2,000 |
| 1 million to 10 million | 784 | about 3,000 |
| Over 10 million | 2,761 | about 6,300 |
Since the engagement rate by views stays around 5% while comments per view fall, likes make up more and more of a Reel's engagement as the Reel grows. In other words, a Reel with a million views and a few hundred comments is a normal viral Reel.
Getting in early matters for comments too
The same numbers apply when you comment on someone else's Reel. On a Reel with 1 million to 10 million views, there are about 3,000 views for every comment, so a comment on a viral Reel can be seen by far more people than a comment on a small one. Though, that same Reel typically has close to 800 comments, so a comment that shows up late is easy to miss.
In our data, comments left in a Reel's first hour earned about three times the likes of comments left a few hours later, so getting in early is what counts. Sociable AI users have earned nearly 1.4 million likes on comments left on other people's Reels.
Sociable AI monitors Reels across your niche in their first hours and flags the ones likely to go viral. We draft a comment that fits the post, you approve it, and the comment goes up while the Reel is still climbing.
Try Sociable AI and get your next comment in early.
Frequently asked questions
What is the average Instagram engagement rate in 2026?
About 0.3% to 0.5%, and it's going down. Quid recorded a drop from 0.36% to 0.30% over the year, and Socialinsider reported a decline of about 24% year over year. When it comes to a single Reel, though, the average only tells you how posts do in general, and a Reel that reaches people beyond your followers can land far above it.
Do carousels or Reels get a higher engagement rate?
Carousels, by a small margin. In Socialinsider's data, carousels average 0.55%, Reels 0.52% and single images 0.37%. That gap is 0.03 percentage points, which is small next to the difference between a Reel that stays with your followers and one that goes viral.
How do you calculate Instagram engagement rate?
Likes plus comments, divided by followers, times 100. For example, a Reel with 400 likes and 20 comments on an account with 10,000 followers has an engagement rate of 4.2%. Dividing by views instead of followers gives you the engagement rate by views, which tells you how often the people who saw the post engaged with it, and that is the fairer number for a viral Reel.
How many views does a Reel need to be viral?
A Reel is viral once it reaches 1 million views, or once its views reach ten times the account's follower count, whichever is lower. For an account with 20,000 followers, that means 200,000 views. For an account with 5 million followers, it means 1 million views, since ten times its followers would be far higher than that.